The “Metamodel” tab
At this tab you will use the Design of Experiments (DOE) generated previously to generate kriging metamodels of the initial sampling. The main idea here is to inspect if the initial sampling providing is capable of predicting the basic form of the functions that you chose/created on the first step (Objective Function, CV candidates and constraints). If the kriging generated by the initial sampling is good enough, you are able to optimize it and refine it on the next step. On this tab you will be able to:
Define the lower and upper bounds for the hyperparameters that will be adjusted to give the best kriging prediction
Define the regression and correlation (kernel) model for your kriging interpolator
Define which variables will have their kriging metamodel built
Inspect several validation metrics in order to conclude if your model is a good representation
Perform k-fold or hold-out validation. On the latter, you will be able to also inspect graphically your model.
Here is an overview of this tab:
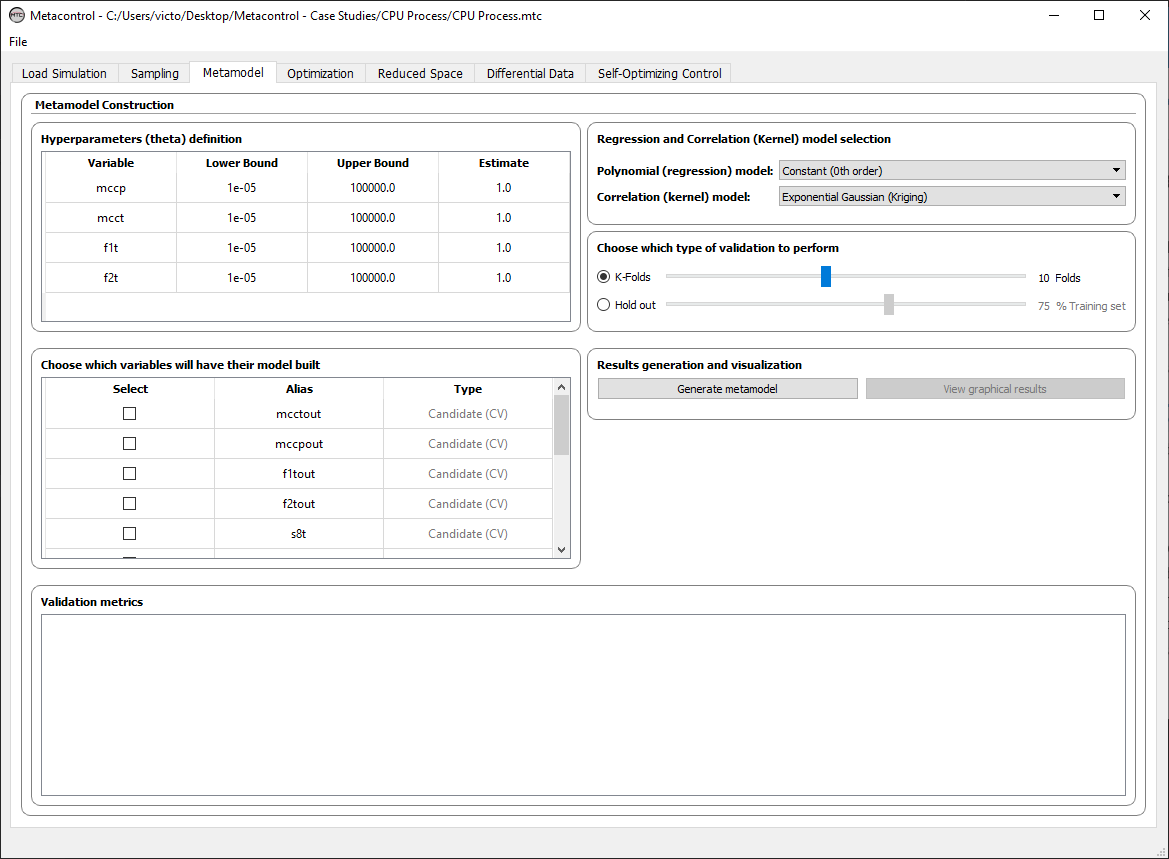
Fig. 30 Metacontrol “Metamodel” tab.
There are six main panels on this tab:
Hyperparameters (theta) definition panel
Regression and Correlation (Kernel) model selection panel
Type of validation panel
Variable selection panel
Results generation and validation panel
Validation metrics panel
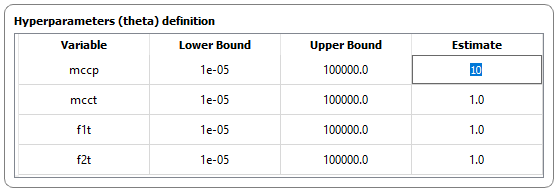
Hyperparameters (theta) definition panel
This is the panel that you will define the upper and lower bounds of the Hyperparameters (theta). There is one hyperparameter for each MV. The disturbances are only included at the “Reduced space” step, since we seek to use the first metamodel to optimize the base case.
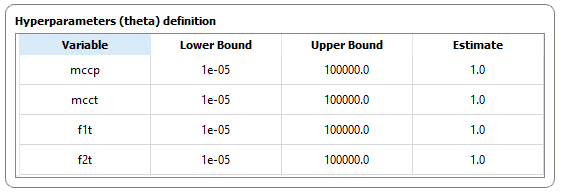
Fig. 31 Hyperparameters (theta) definition panel. Note that the aliases that you chose for each MV are used all over you Metacontrol case study, including here.
Important
Generally, you do not need to change from the defaults values used in Metacontrol, since internally PyDACE does a pretty good job in optimizing the Hyperparameters to maximize the likelihood. We recommend to change the bounds or even the estimate only if you are not satisfied with the prediction produced. For the mathematical aspects and a deeper explanation on how the hyperparameters (and kriging itself) works, check our “Theoretical Backgrounds” Section.
Regression and Correlation (Kernel) model selection panel
This panel is used to configure which regression and correlation (kernel) model will be used in your kriging interpolator.
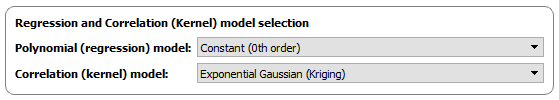
Fig. 33 Regression and Correlation (Kernel) model selection panel.
Selecting the regression and correlation models
Just use the dropdown list to select the regression and correlation models.
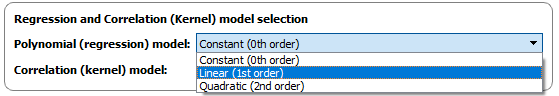
Fig. 34 For instance, selecting your regression model.
Important
Currently, Metacontrol gives you the constant, linear and quadratic options for the regression model, and the exponential for the kernel. On future releases, different kernels will be added.
Type of validation panel
This panel will give you the possibility to opt between hold-out (leave-out) or k-fold types of validation. The number of folds and the percentage of DOE data separated for the training set in the case of hold-out validation can also be configured.
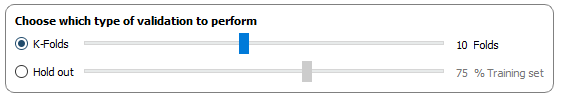
Fig. 35 Type of validation panel.
Performing a hold-out Validation
Select the radio button for hold-out validation and define using the slider the percentage of the initial sampling that is going to be used to build your model. The remaining will be used for test purposes.
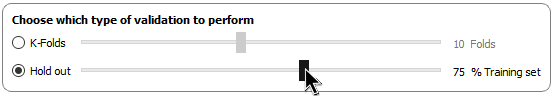
Fig. 36 Configuring hold-out validation.
The Metacontrol default is to leave 75% of the DOE data for construction and the remaining for validation purposes.
Performing a k-out Validation
Select the radio button for k-fold validation and define the number of folds to be considered using the slider.
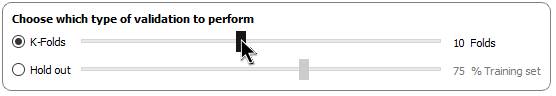
Fig. 37 Configuring hold-out validation.
Important
For a theoretical background on hold-out and k-fold validation, refer to our papers and our theoretical background section.
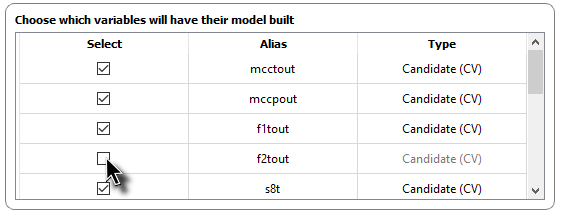
Variable selection panel
On this panel you can choose which variables will have their model built. Metacontrol gives you this feature in order to give you the chance to inspect groups of variables, for instance.
Results generation and validation panel
After configuring the hyperparameters bounds/estimates, choosing your kernel and regression models, selecting which variables do you want to have kriging responses generated and the type of validation, you can use this panel to generate your kriging responses.
If you choose k-fold validation, you will see that the Validation metrics panel is now with several metrics to evaluate your kriging model.
If you choose hold-out validation, you will see that, in addition to the results of the Validation metrics panel, the button “View graphical results” is available.
Graphically inspecting your results
The classic predicted data versus validation data validation plots are available in Metacontrol, if you opted for hold-out validation. Simply click on “View graphical results” button, and a screen with a plot for each variable that had its kriging response built will appear:
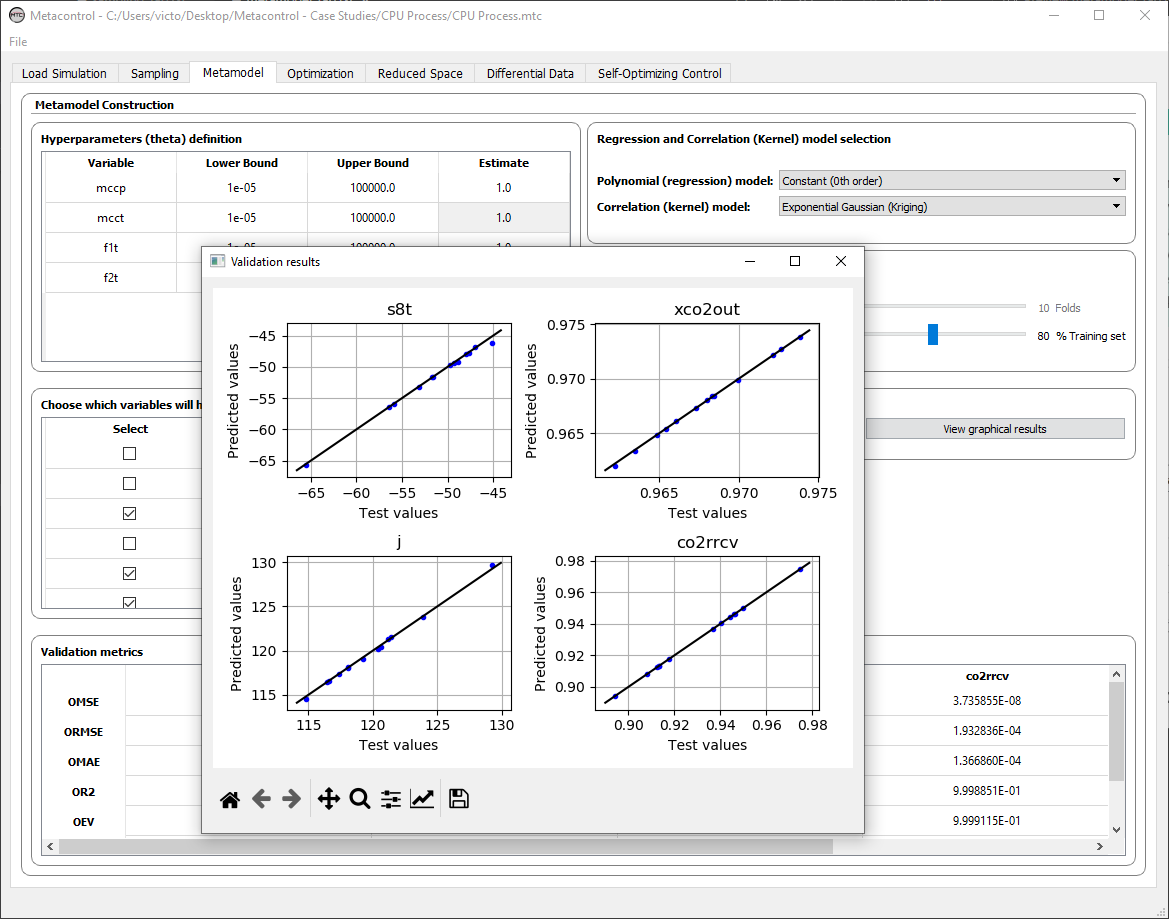
Fig. 39 Graphically inspecting your kriging metamodels fitness against validation data.
Taking a closer look to the “Validation Results” windows with the plots you can see a panel at the bottom with several buttons. They allow you to:
Reset the original view, if you change it
Pan axes with left mouse, zoom with right
Zoom to rectangle
Configure subplots
Edit axis, curve and image parameters
Save the figure to use it elewhere.
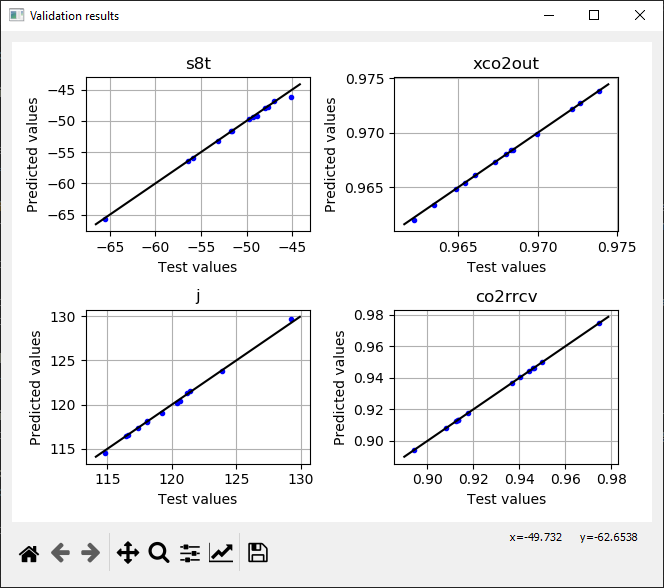
Fig. 40 Thanks to matplotlib package used in Metacontrol, you are able to perform several inspect operations and save your plot.
Validation metrics panel
This panel is completed after you generate your kriging metamodel. It allows you to see several metrics in order to assure the robustness of you kriging response.
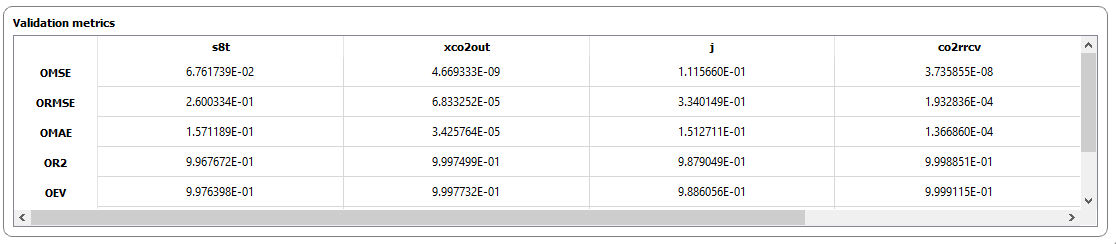
Fig. 41 Validation metrics panel.
The metrics are:
OMSE = Overall Mean-squared Error
ORMSE = Overall Root Mean-squared Error
OMAE = Overall Mean Absolute Error
OR2 = R² value
OEV = Overall expected Variance
Sample Mean
Sample Standard deviation