The “Self-Optimizing Control” tab
At this tab the self-optimizing control structure selection is made. You will be able to:
Provide the expected disturbances and implementation/measurement magnitudes to be taken into account in your study
Inform Metacontrol how many best (that incurs in the lowest loss) structures do you want to analyze for each possible control structure subset size
Inspecting in ascending and descending order all evaluated control structures
Inspect the condition number of each control structure
Inspect linear combinations of controlled variables, if you chose to analyze more CV candidates than the unconstrained degrees of freedom available.
This tab looks like the picture below, before you start to fill the necessary data:
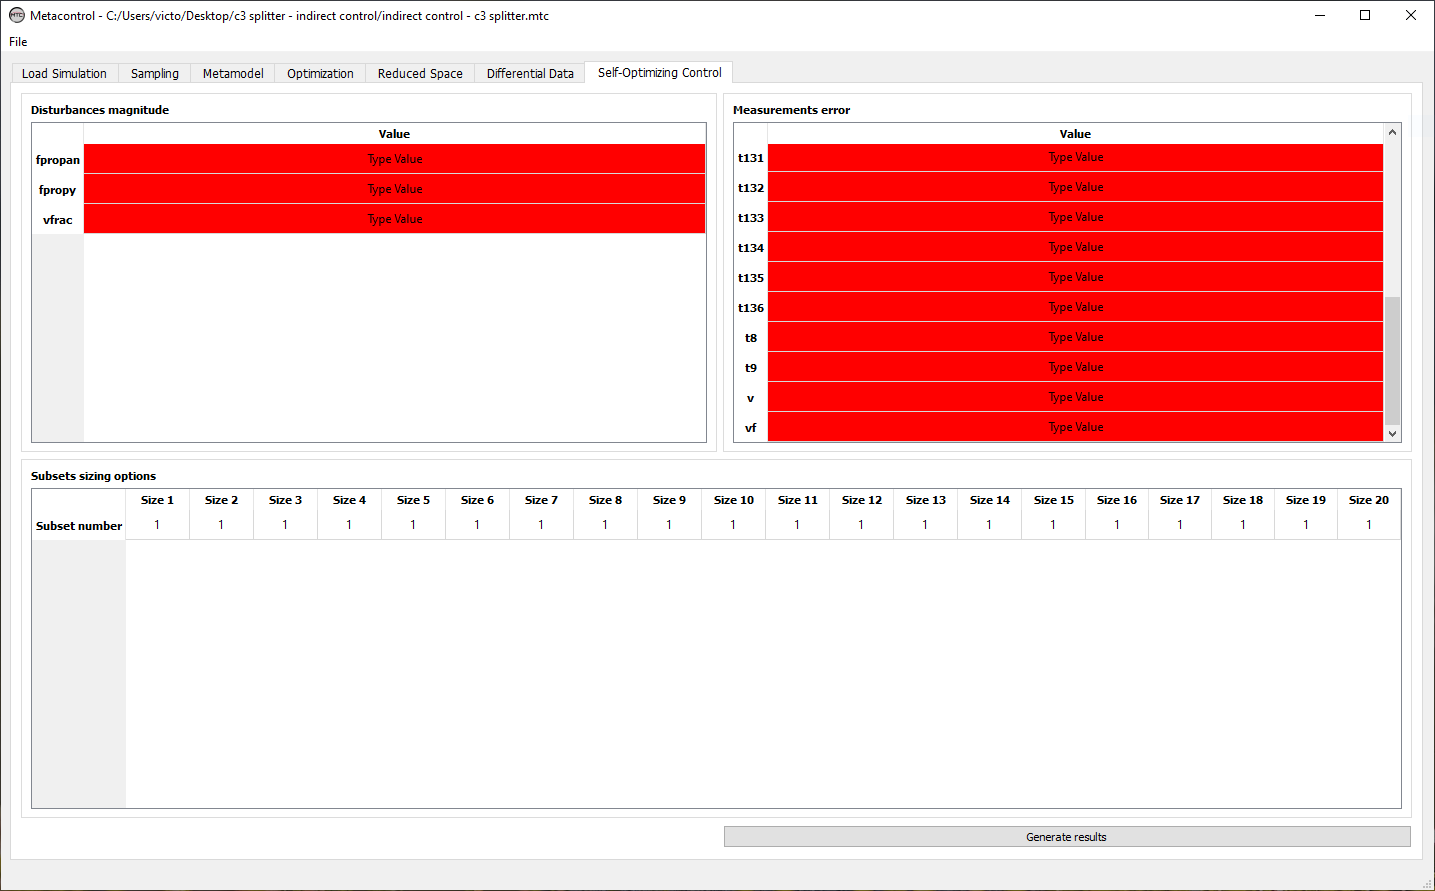
Fig. 68 Metacontrol “Self-Optimizing Control” tab.
The forms are red because you need to supply the data for the disturbances and implementation/measurement errors magnitudes.
There are three panels at this tab:
Disturbances magnitude panel
Measurement error panel
Subsets sizing options panel
Disturbances magnitude panel
At this panel, you will inform to Metacontrol the expected magnitude of the disturbances. As an example, see the figure below, where it was considered 10% of the nominal value for the variables fpropan, fpropy and vfrac:
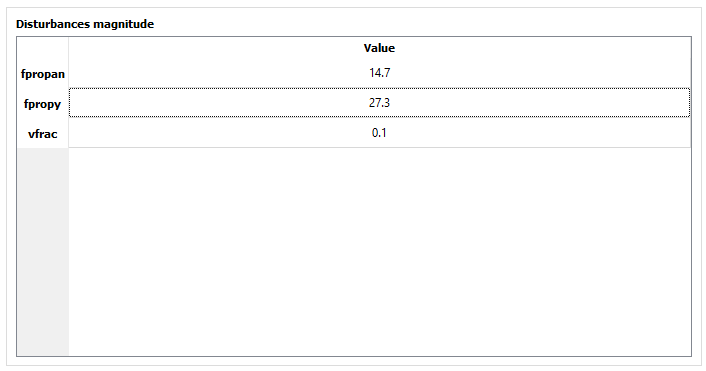
Fig. 69 Entering disturbances expected magnitudes.
Measurement error panel
At this panel, you will enter the expected implementation/measurement error. For the example on the figure below, it was considered 0.5°C for temperature measurements and 0.001 for flow measurements.
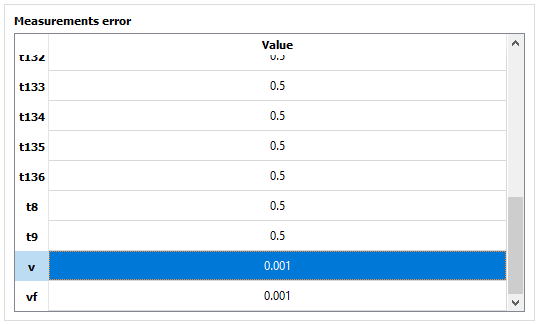
Fig. 70 Entering measurement error expected magnitudes.
Subsets sizing options panel
At this panel you will determine how many best control structures will be reported to you by Metacontrol, for each possible subset size:
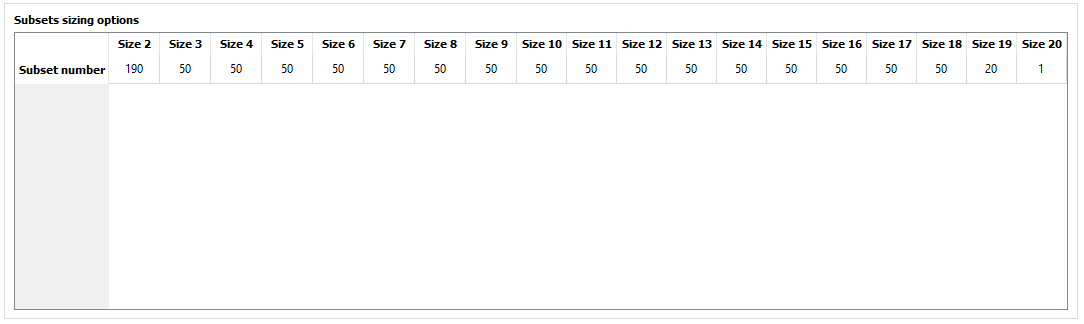
Fig. 71 Entering measurement error expected magnitudes.
Metacontrol and the maximum number of possible control structures for each subset size
Metacontrol automatically calculates the maximum number of possible control structures for each subset size.
For the example shown in the previous figure, there are 20 CV candidates and two unconstrained degrees of freedom available. For a single measurement policy (using one single CV candidate for each MV) there are
possible control structures. If the user tries to evaluate 191 (which is impossible), Metacontrol will prevent him from doing this:
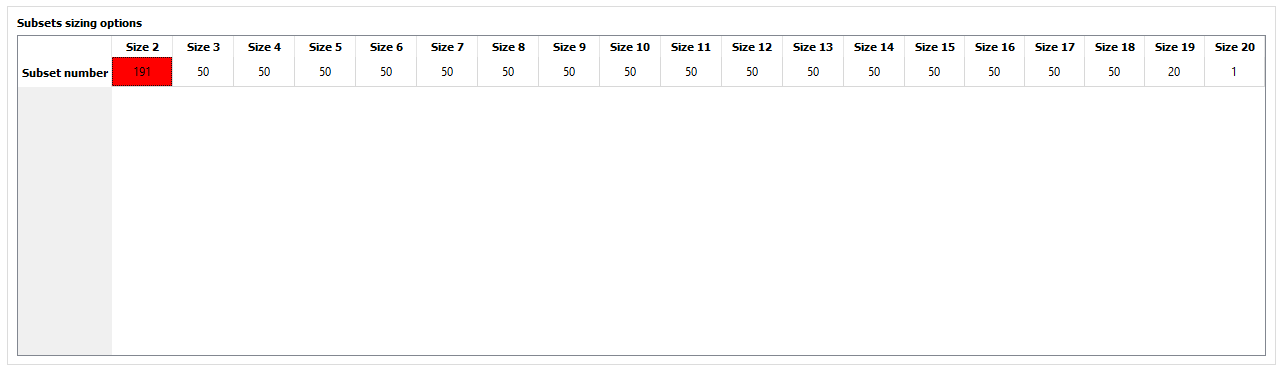
Fig. 72 Metacontrol avoiding impossible evaluations.
Analyzing your results
After completing this tab with the all necessary data, you can click on “Generate Results”, and a window will appear:
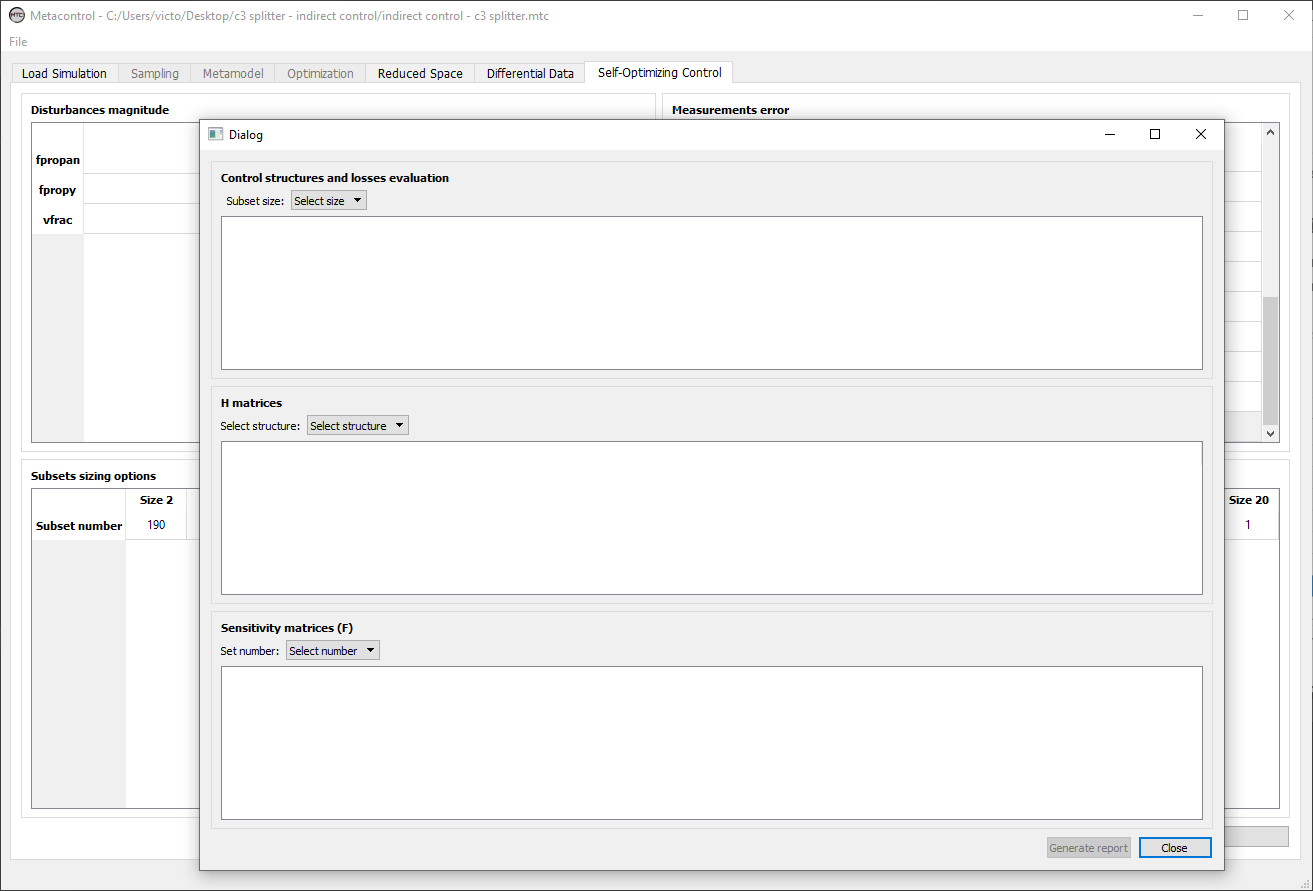
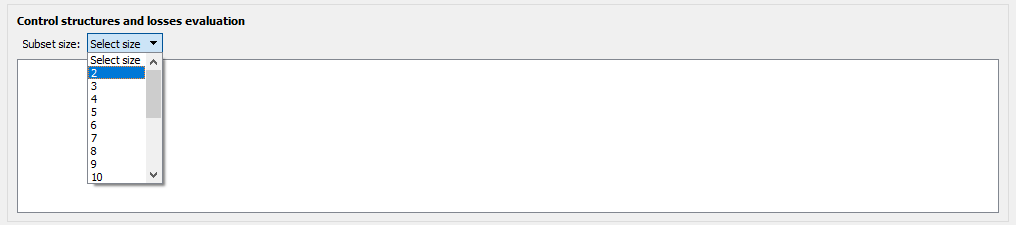
You can select which subset size you want to analyze:
The linear combinations generated for the possible control structures:
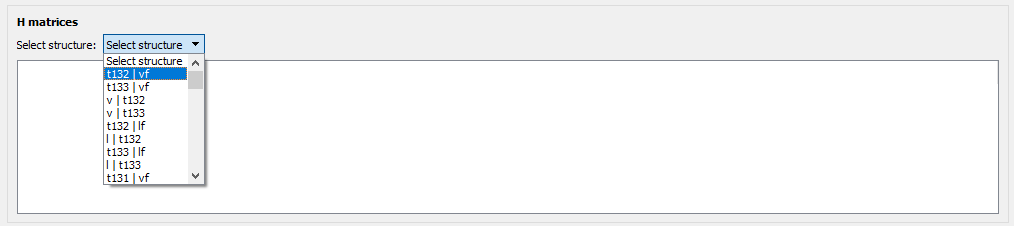
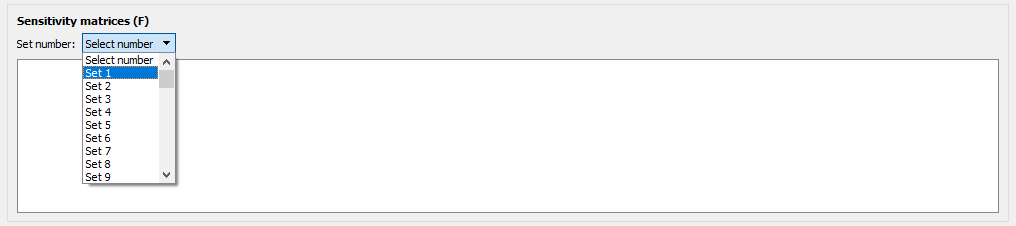
And the sensitivity matrices for each possible control structure evaluated:
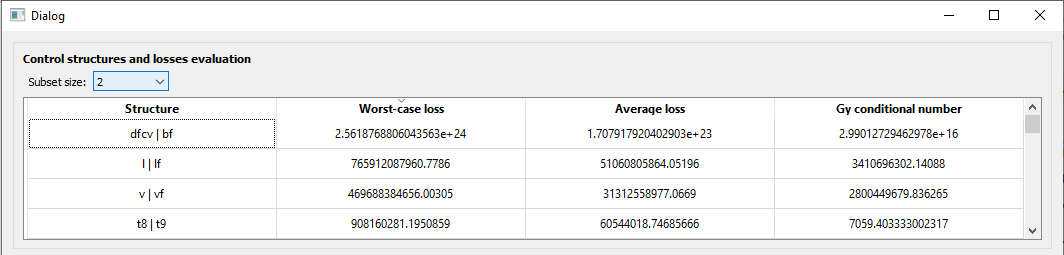
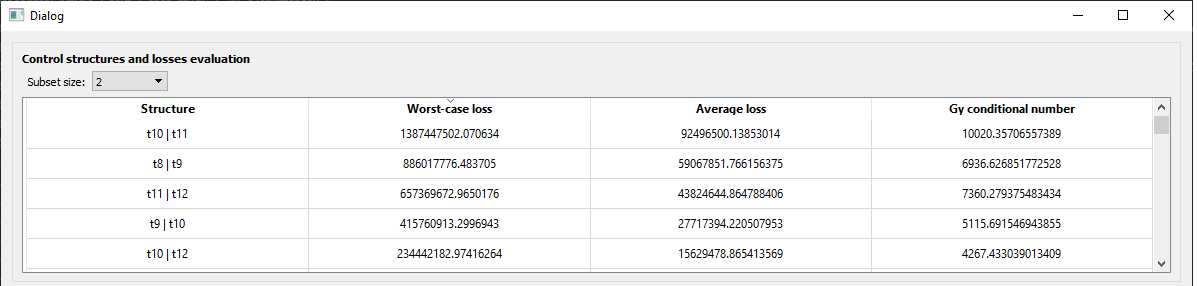
In addition, you can arrange the control structures in ascending and descending loss value order, to ease your study:
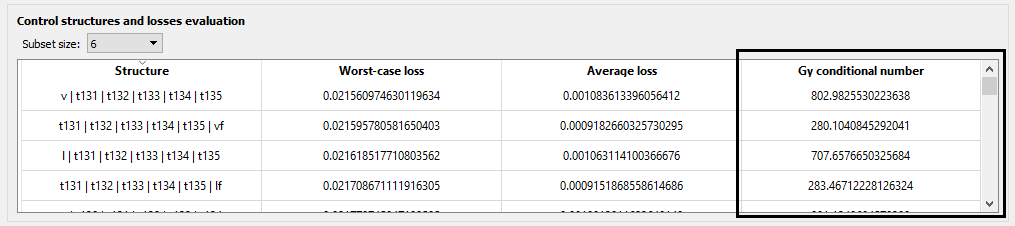
For any subset size! For example, linear combinations of 6 measurements for this particular case shown here for illustration purposes:
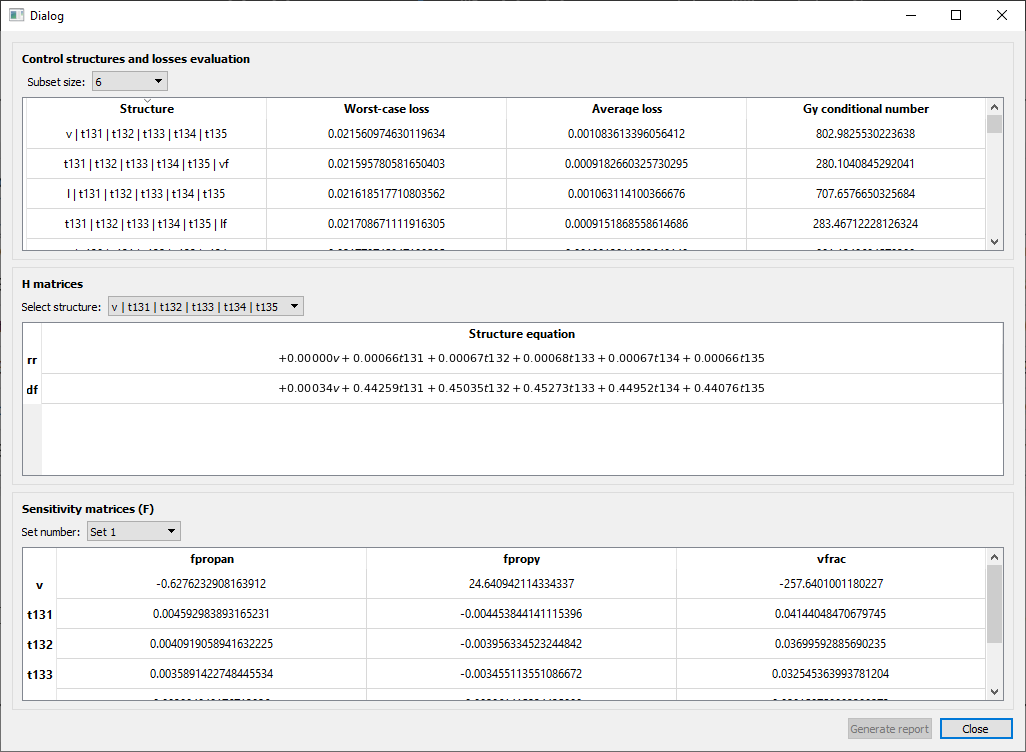
And inspect other controllability measures, such as the condition number (highlighted with a black-box):